Spare the Heat! Heat Wave Durations Set to Increase Across the World or AKA I Said So
Blog on the heatwave prediction model
Ramasubramaniam
6/21/20252 min read


The mainstream media surely knows how to clickbait! I opened the browser today and there you go. Yet another disaster looming over the heads. Its either the Trump tariffs, or Iran Israel talks or when you don’t find one: Call the weatherman in. Heat waves are bad, but it is even bad to see the mainstream media amplifying things to extent people go back to bed assuming things are going to get worse in the near future. Just to get a heads up, I watched the CBS news headlines on this. Well you’ve got those comperes with nice suits pitching for the “well, sorry-to-say guys, we’re all gonna die of heatwave in the near future”.
You know when they present it, they present it with authority. To validate their agenda, they call the experts in who debates it to death. US or India, the pattern persists. Call the apparently “been-there-done-that-experts” who can vouch for your cause. You want to time and again remind people of the doomsday predictions. Anyway, here is the whitepaper link to the paper:
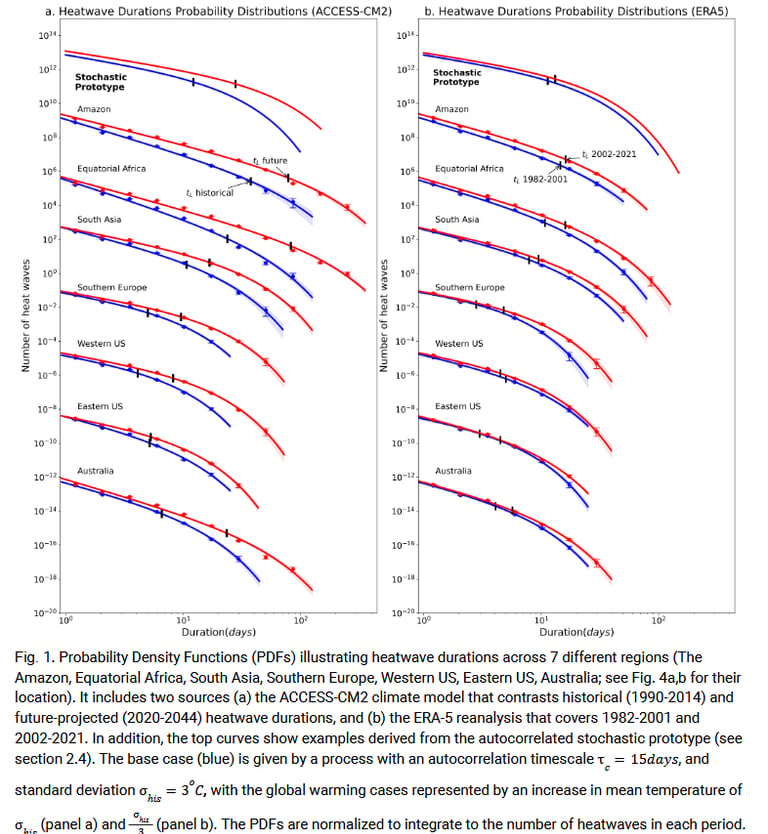
Here is the first chart from the article that I picked up from the whitepaper. You can clearly see the extending lines of red and blue. Blue is the historical averages and Red is the projected durations based on a nonlinear model of timescale and temperature! Can you believe it? To my tiny brain with whatever tiniest knowledge that I know of the weather, I can confidently say that “You simply can’t capture such a complex phenomena using just two variables!!”.
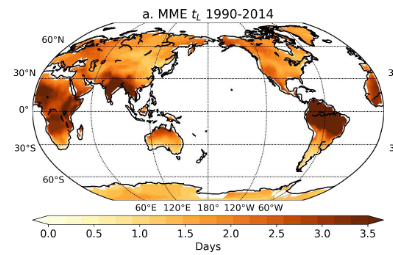
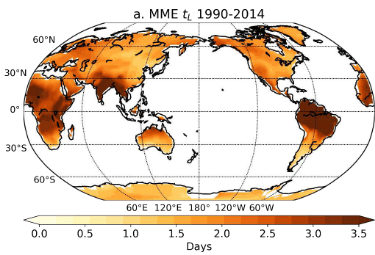
In the name of simplification for modeling, the paper has oversimplified things. Look at those nice smooth lines both blue and red, I’m quite sure actual durations aren’t going to be any closer to that behavior. To add more evidence to this argument, look at their own graph of the world map in gradient colors represented using heatwave duration and temporal autocorrelation. This map demonstrates variations across the globe, indicating the model was able to show the differences across the regions. It maybe true that the durations depend on the previous heatwave durations, but the fact remains that this time series model is an oversimplified representation which we have to take with a pinch of salt. Well, being an academic, I get it. Publish anything that can attract the journal’s attention that you overlook research basics of validating the implied thesis you started with but remains unanswered – Can heatwave durations be modeled and predicted using just 2 variables?